Probe Plugin Primer
In a previous blog post, we introduced the probe plugin and how it tests whether a channel is functional by sending a test payment through it and then observing how it fairs. The payment fails, since it doesn’t match an invoice on the recipient’s end, however from the error returned we can infer whether we reached the destination or which channel failed, and what the cause for the failure was.
Quantifying the Lightning Network
This article breaks the format of the previous installments of the Plugin Series, as we take a closer look at the information we can collect using the probe plugin and use it to analyze the network’s performance metrics. The goal is to quantify some of the characteristics to:
- Set realistic expectations for our users;
- To inform our specification and development processes.
Deploying the Probes
With the probe plugin in our toolbox, it is time to put it to good use. We set up a c-lightning v0.7.2 node with six small channels to well-connected nodes in the network. The capacity is not really important for the measurements we are performing here. But the connectivity is important since we can’t say much about remote nodes if we are causing most of the failures ourselves. In the future, we plan to extend our experiments to include larger value probes to gauge success rates for larger payments as well.
We’ll perform a simple reachability experiment in which we send a small probe to each node we know about and see if we were able to reach the node, or where and how it failed. It’s worth pointing out that this is also a bit of a worst-case scenario since we are contacting a lot of nodes that are end-user nodes and not online most of the time or have very unbalanced channels.
Each node in the network maintains a local view of the network’s topology, which is the nodes and channels that make up the network. For this purpose, nodes exchange information about the channels and nodes that are present in the network using the gossip protocol. The local view is used to compute routes from the sender to the destination when performing a payment. It doesn’t have to be perfectly up to date, as long as a node knows enough about the network it’ll be able to find a route. In order to locate as many nodes as possible, our c-lightning node connected and synchronized gossip for a couple of days before starting the experiment. However, this does not include non-public channels and nodes, and we’ll discuss further down how much of the network we can actually see.
We started by taking a snapshot of the network using the c-lightning JSON-RPC commands listchannels and listnodes. This snapshot consists of:
- 4,431 nodes, of which 829 accept incoming connections by publishing IP or TOR addresses.
- 27,394 channels with a total capacity of 827 bitcoins.
If you are wondering why these numbers don’t match up with the commonly reported numbers, that is because — unlike some of the explorers — c-lightning:
- Implements all the rules for gossip pruning, e.g. pruning channels that have not sent a keep-alive update for two weeks;
- Pruned nodes that do not have active channels.
Therefore, we expect the numbers reported by c-lightning to be more accurate and contain less useless channels and nodes.
To speed up the experiment, we modified the probe plugin slightly to allow parallel probes and added a 30-second timeout for individual proves. With these changes, a full run probing all 4,431 nodes takes just shy of 25 minutes.
Initial Results
Below we show the results of the successful single-shot payment attempts when trying to send a single payment to all nodes in the network.
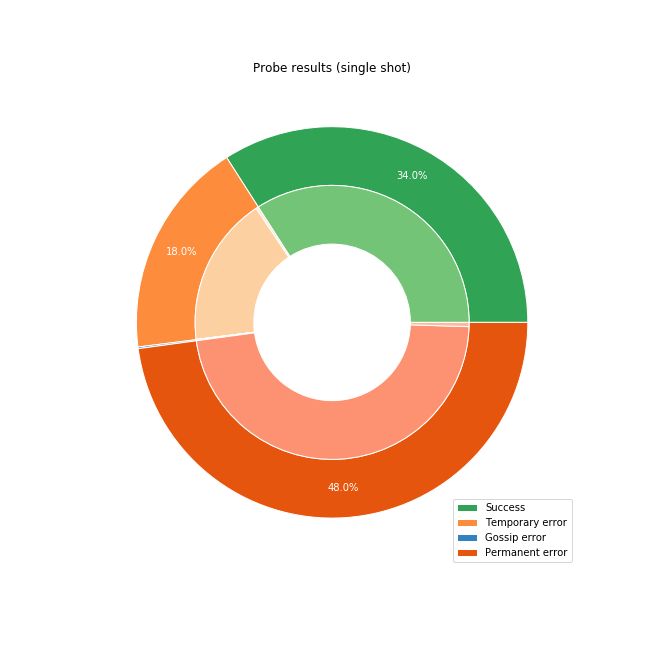
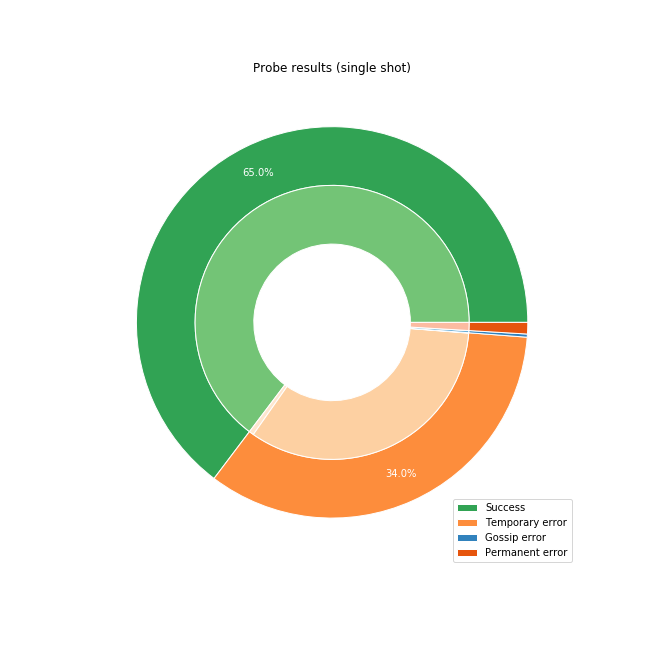
We divided the results into four categories:
- Success: we received a 16399 error, meaning we reached the destination, but it didn’t have a matching invoice and therefore rejected the payment.
- Temporary error: the probe encountered a problem somewhere along the route, but we can retry, and could still reach the destination.
- Permanent error: we have exhausted all of the routes we could find, and we have to fail the payment
- Gossip error: we tried to use a channel, but added insufficient fees, based on an out-of-date view of the channel. These can be retried by adjusting the local view and re-attempting the same route again.
In the tests shown in the images above, we started by sending a single probe to the destination and see what the results are. The first observation is that a large number of nodes in the network are not reachable at all. These are nodes that have no active channels and are likely offline. The channels are marked as disabled internally and will not be considered when searching for a route.
There is very little we can do for these nodes. Since they are offline, they can’t possibly receive a payment. They should most likely not be announcing themselves in the network since they can’t be used for routing. Most implementations will default to announcing (Eclair being the notable exception here), but the lesson here is that we as developers should make it easier for users to opt-out of announcing their channels if they don’t plan on routing payments.
Once we remove the nodes that are disabled based on our network view, we get that 65% of first-attempts are successful, and no further retry is needed. 1% of attempts are permanent or gossip errors, which means that we were using out-of-date fee-rates or the final node failed despite us finding a route initially. The latter case is often due to the staggered broadcast which artificially delays gossip broadcast to reduce the load on the network, or due to an update that was not broadcast yet. For the remaining 34%, we can retry the payment with a different route, by marking the failing channel as temporarily unavailable and computing a new route.
Probing with Retries
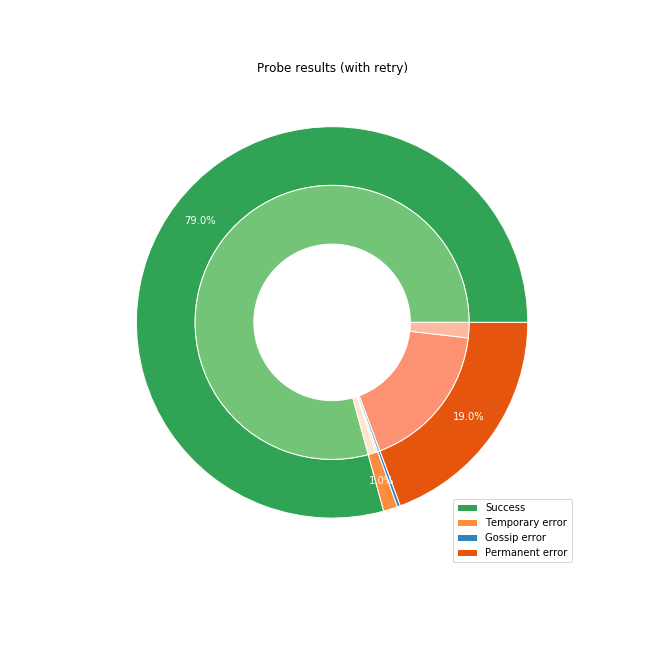
After retrying the payment until it succeeded or exceeded 25 attempts, we get the situation depicted above. A total of 79% of all probes to non-disabled nodes eventually reached their destination, with another 19% exhausting all possible routes and failing. We decided not to retry the remaining 2% and consider them failed for our purposes since 25 attempts already take a rather long time to complete.
How Fast Are Payments Being Delivered?
Speaking of the time it takes for a payment to complete, that is the second important dimension we looked at. After all, having a system with a high success rate is very nice, but if it requires the user to stand in front of a point-of-sale for minutes or hours, that’s not much of an improvement to on-chain systems.
So we aggregated the probes for each destination and counted:
- How many attempts were required to get a success or a permanent error;
- How much time had passed between the first attempt starting and the last attempt completing.
As before, we excluded disabled nodes since they’d be finishing on the first attempt and in about a tenth of a second.
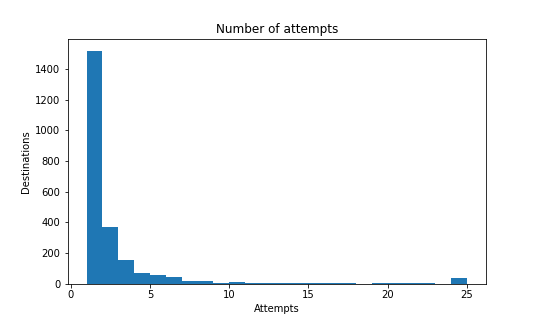
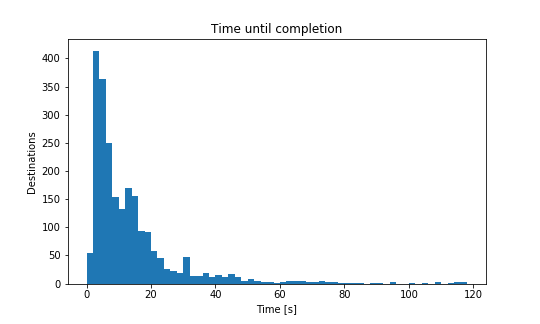
The median time to completion was 13.12 seconds with just one attempt, which means that half the payments complete faster and with only a single attempt. Even more encouraging is that 40% of payments completed in less than 10 seconds and a single attempt. However, the distribution has a long tail, and 10% of payments require more than four attempts and take longer than 30 seconds.
The takeaway is that it is worth concentrating on the long tail of the distribution and consider the median case as good enough for now. After all, you’ll always remember the one time you got stuck in front of a point-of-sale, but not all the times it worked flawlessly ?.
We already have several improvements planned, such as probing for latency in parallel with the first payment attempt, which would allow us to prefer fast paths over slower ones or split a payment using multi-path routing.
How Often Are Payments Getting Stuck?
Finally, let’s talk about the elephant in the room: stuck payments. These are payment attempts that take a long time to return success or error and are caused by nodes becoming unresponsive while they were forwarding the payment HTLC. Since the node is unresponsive, it’ll not settle the HTLC, and the payment attempt is stuck. This is bad for user-experience since the user cannot determine whether the stuck payment attempt will ultimately fail or succeed, which also means the user cannot simply retry. There have been a couple of proposals to address this issue, but how often does it actually happen?
Out of the 7,659 payment attempts we performed during the probing of the network, a mere 14 attempts got stuck. That means only 0.19% of all attempts would have resulted in a slow payment experience. While we should not take this too lightly, it means that stuck payments happen less often than most of the specification developers were expecting. Besides giving us insights into the network, probes have the side-effect of exercising the channels as a payment would. If a channel is non-functional a probe will result in it being disabled or closed before a real payment can get stuck. This is important since a stuck payment would lead to a bad experience.
A New Baseline
In conclusion, we believe these results to be very encouraging. While this worst-case scenario has shown a number of issues that we need to address going forward, it is likely that the average user-experience is far better since they’ll likely be sending and receiving payments to well-connected nodes. The measurements serve as a baseline on which we plan to improve over the coming weeks and months, and they help us guide the development towards the areas that need it the most. Our journey is far from over, but at least now we know where we stand and where we are going. ?
To learn more about developing powerful plugins on c-lightning, check out our beginners’ guide, or come chat with us on IRC (#c-lightning on Freenode).
This was the first showcase in a series on c-lightning plugins. For a regularly updated list of available articles, head to our introduction to c-lightning plugins.
Note: This blog was originally posted at https://medium.com/blockstream/c-lightning-plugins-05-probe-plugin-results-984a18745e93
