By Lisa Neigut and Martin Izdimirski
Overview
- Purpose: Output Lightning node data to a monitoring platform for charting and alerts
- Language: Python
- Code: Github
- Documentation: README
The Prometheus Plugin
Sometimes you want to obtain information about your Lightning node’s performance at a glance, without having to dive in to the command line or log into your node.
The Prometheus plugin, written by Christian Decker, turns your c-lightning node into a data source for Prometheus, a third-party timeseries datastore. Collecting node data in Prometheus enables us to chart it with Grafana and set up alerts with the Prometheus Alertmanager.
This is particularly useful for c-lightning node installations in mission critical applications, where you need to be able to quickly view and respond to outages or alerts.
At Blockstream we run a number of production Lightning nodes, most notably the Blockstream Store and the payment system for the Blockstream Satellite. By plugging in our node stats in Prometheus and Grafana, we have visibility into our production systems and timely alerts for system problems.
Technical Details
In this article we’ll briefly explain how Prometheus works, demonstrate how to use Docker to install it alongside your c-lightning node, share a few graphs in Grafana that we find useful, and finally give an example of how you can set up alerts.
Setup
You will need Docker installed in order to run all the different services as Docker containers. These instructions assume you are running a Bitcoin full node.
Before we can view pretty graphs, we need to set up our c-lightning node, Prometheus and Grafana. We’ll be using the official Prometheus and Grafana Docker images, which are maintained by their respective organizations.
A quick note on security: this setup is mainly using default settings. Don’t forget to do your own due diligence and go through the appropriate configuration options and security recommendations for your setup.
Setting up our c-lightning node for Prometheus
By default, the plugin will collect stats from c-lightning and expose them locally at port 9900. This is defined in the prometheus plugin, and can be configured with the prometheus-listen option:
 262588213843476
We have set up Prometheus to scrape this port in the lightningd job in the prometheus.yaml (see below).
Now, let’s bring up a LN node on mainnet using Docker. The Prometheus plugin has already been installed in the blockstream/lightningd:prom Docker image that we will use. You can review the Dockerfile that was used to build the Docker image here. You’ll have to take our word for having used that exact Dockerfile for the image, or you can build it yourself :).
Next, we need to configure our Lightning node. Here’s a basic lightning.conf:
262588213843476The lightning.conf has a plugin-dir option, which tells lightningd where to look for pre-installed plugins; the default directory is ~/.lightning/plugins. We’re not using the default, so we set it here.
For more information on lightningd configuration options, see the docs or run docker run blockstream/lightningd:prom lightningd — help.
Let’s start the c-lightning container. Create a ~/extra/lightning directory, and make a lightning.conf file inside of that. Then run:
262588213843476Once this has been completed, you should have a lightning node running locally with the Prometheus plugin enabled. Test it with curl localhost:9900 or run a curl command inside the container — docker exec lightning curl localhost:9900. That should return some text that Prometheus will be able to understand.
Monitoring Setup
Prometheus
Now, let’s setup Prometheus. By default, Prometheus collects metrics from specified endpoints. It will scrape for messages on a port (in our case 9900) and it will store those metrics for you in a time-series database.
The Prometheus configuration is stored in prometheus.yaml. Our example is very simple — it tells prometheus where to look for its alerting rules, how to communicate with Alertmanager (if you decide to use it) and a single scrape job that specifies the job name, scrape interval and the endpoint.
If you’re on a Mac, you may need to replace localhost with 172.17.0.1 (the docker bridge network).
262588213843476We also need to create an alerts.yaml file, which will contain our various alerting rules. Alerts have a query expression (expr) line, which specifies what Prometheus should alert on. More useful functions for alert expressions can be found in the Prometheus docs. Try out different alerts in Prometheus’ Graph tab (localhost:9090/graph).
Here’s a basic example with two alerts:
262588213843476Start the Prometheus container. Make sure you have created the necessary directories, in this case ~extra/prom/data, ~/extra/prom/prometheus.yaml, and ~/extra/prom/alerts.yaml.
If you’re using a Mac, replace ` — network=host` with `-p 9090:9090`.
262588213843476You can go to localhost:9090/targets to verify that Prometheus can find your c-lightning node — its state should be UP.
If you’re getting context deadline exceeded or connection refused messages, make sure prometheus can reach your c-lightning node’s scrape metrics at localhost:9900 (Use docker exec -it prometheus bash to debug from within the container). Another useful debugging tip: on /alerts, click on each expression and test if it returns anything when you remove the condition == 0. If you see non-zero values, the alert isn’t active. That’s a good thing — you have peers and you can see your node’s info.
Alertmanager provides a lot of integrations for delivering the alert: SMTP Smarthost, OpsGenie, Slack, etc.
Here’s an example on how to use Google’s SMTP relay and OpsGenie. You’ll need to update this with the appropriate email_configs, and api_key.
262588213843476Start the Alertmanager container:
262588213843476Great! Now we’ve got Prometheus and Alertmanager set up. You’re ready for your first outage.
Grafana
It’d be nice if we had better visibility into our node even when there isn’t an alarm going off. For this, we’ll setup Grafana, a best-in-class graphing service that works well with Prometheus.
To link up Grafana with our Prometheus data, we’ve provided a datasource file. With it, Grafana will install your local Prometheus as a data source. This will link the two services without any additional configuration on your part.
262588213843476Start the Grafana container. Again, make sure you have created the appropriate directories: ~/extra/grafana, ~/extra/grafana/data, ~/extra/grafana/provisioning, and that you’ve placed the above datasource config in the correct place.
262588213843476Seeing Lightning with Grafana
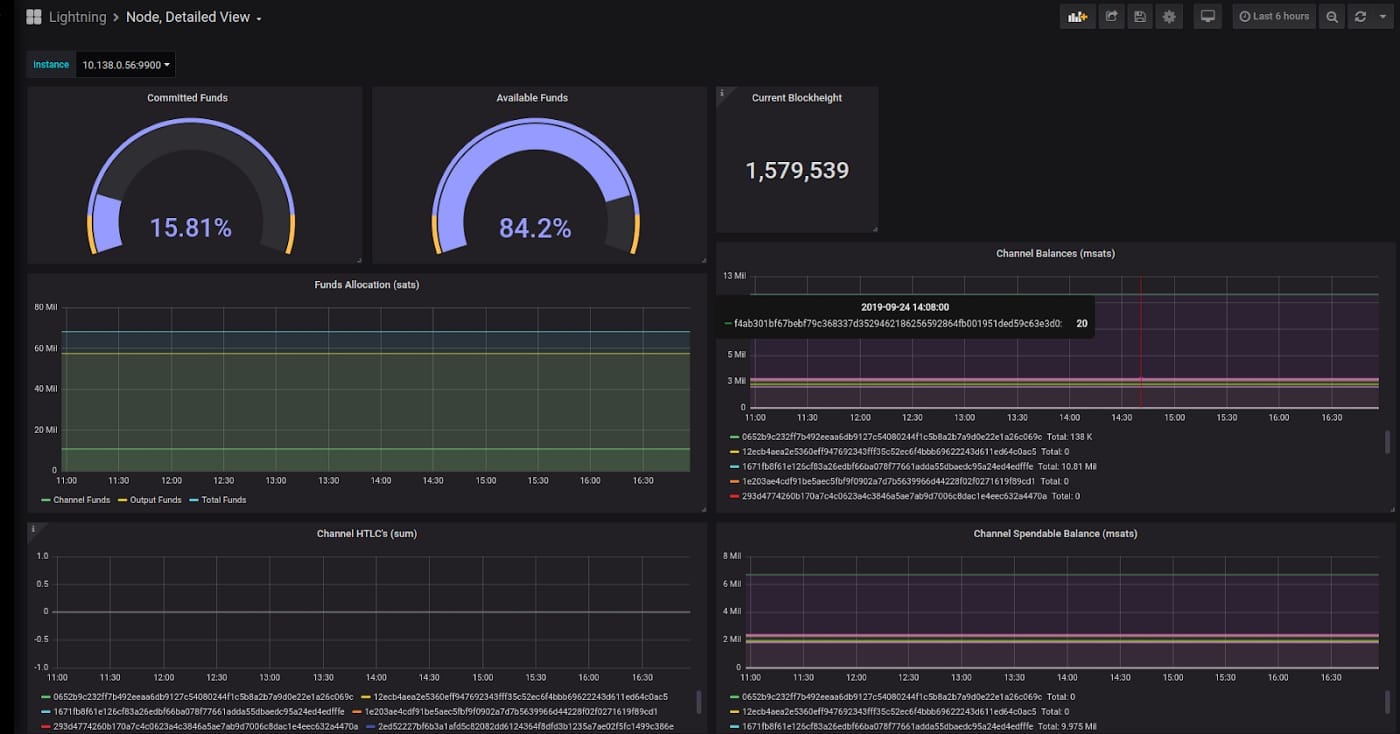
When Grafana is launched, you should see the login page at http://localhost:3000. (It can take up to 30s for Grafana to start up.) The default login credentials are admin/admin. After you login, you’ll be able to create your first dashboard:
Click on New Dashboard -> Add Query -> Select LN from the Query dropdown -> Select a lightning metric from the Metrics dropdown.
Try seeing all your channels, or your htlc throughput. Once you have a set of graphs you like, save the Dashboard by clicking the diskette at the top right.
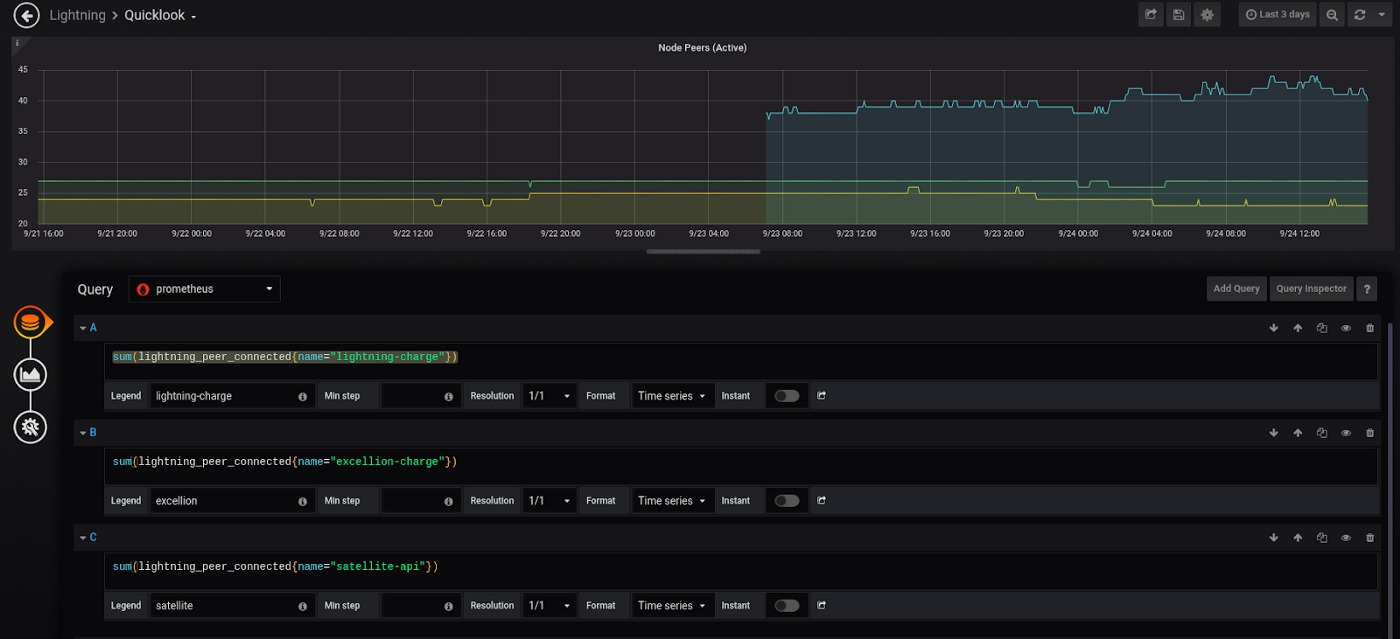
Here’s a closer look at the dashboard panel for tracking our active peers over time. We have three different nodes that we’re using, so we’ve added a separate query for each one:
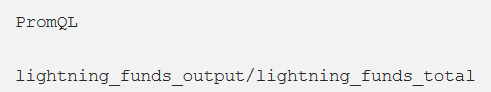
Another useful graph is to know the current balance of your total funds that is currently locked up into channels. You can use a gauge to create a current snapshot for your node.
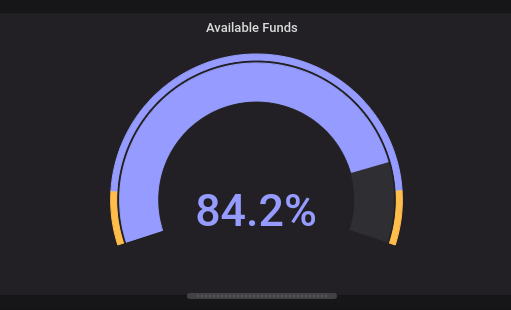
The query for this is simply.
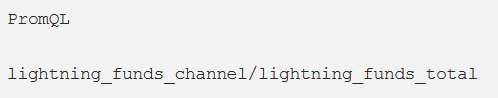
You can do the same for funds committed to channels with
That’s all there is to it. If you’d like to use the dashboards we’ve made, you can find the JSON for the many node overview here. The JSON for more useful single node statistics is here. Note that this one has a dropdown list that allows you to select a specific node to view the stats for. If you only have one node, you’ll want to remove all of the ‘instance’ references.
Putting it All Together with docker-compose
You can run each Docker container as outlined above independently, but for your convenience we’re including a docker-compose file, which should allow you to run it all by issuing a single command — docker-compose up -d (Note: you may need to install docker-compose).
docker-compose may not be ideal for production environments. Another approach would be to break the docker-compose.yaml into separate systemd services.
262588213843476Get Started
Prometheus integration is just one of the many c-lightning plugins. You can find more community developed plugins on our plugin repository: lightningd/plugins.
Interested in building your own plugin? Check out our PLUGINS readme in the lightning Github repo, or check out Rusty Russell’s webinar on getting started with c-lightning.
This was the first showcase in a series on c-lightning plugins. For a regularly updated list of available articles, head to our introduction to c-lightning plugins.
Note: This blog was originally posted at https://medium.com/p/75c6d733a2a3